
Access to quality data is an important part of making informed decisions on how to best position your business or investment for success. We have compiled all the statistical information on Langley City available so you can find the data you're looking for in one place.
Statistical Profile Summary
For a quick overview of Langley City data, start here. It includes basic stats on demographics, the labour force, education, and land development.
Community Profile
The Community Profile provides a more comprehensive set of information on Langley City, with both statistics and detailed description provided on the City's land development trends, demographics, education and employment, infrastructure, costs, and quality of life.
Community Survey
Langley City conducts extensive community surveys every three years to obtain residents' feedback on municipal initiatives, community issues, and overall quality of life which helps the City respond effectively to public priorities and ensure that its programs and services are consistent with what the community wants. For potential investors, the Community Survey can be a valuable resource, as it provides a snapshot of public opinion that can be responded to or accommodated, along with a different perspective of Langley City.
As a centre for retail, commercial, and industrial activity, Langley City is a workplace destination for residents throughout Metro Vancouver and the Fraser Valley. In fact, Langley City has a greater number of employees than workers residing in the city. The employment rate in the city is typically higher than the rest of the province, with a labour force of over 325,000 people within a 30 minute commute.
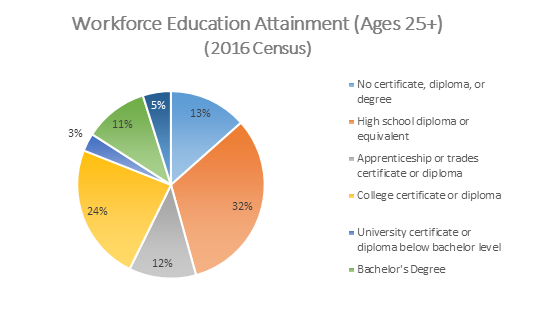
Over 55% of the City's working-age population has some level of post-secondary education:
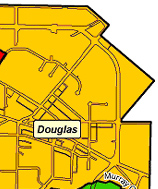
Average household income in Langley City is $77,507, with variation between neighbourhoods. For example, in Douglas, which has smaller household sizes and a high senior population, the average household income is $61,010. In a neighbourhood such as Uplands, which has larger household sizes, the average household income is $102,694. For comparison, the average household income in Metro Vancouver is $99,723.
Low costs of living and business operation are a key Langley City advantage. Despite our central location as a major commercial centre for a fast growing and affluent surrounding residential area. Langley City continues to boast low business property taxes, housing costs, and development charges.
NAIOP Industrial Survey
NAIOP, a commercial real estate development association, releases annual cost of business surveys for land development in Metro Vancouver. It includes information and comparisons between different municipalities in the region on municipal fees, development approval timing, building permits issued, and commercial-to-residential property tax ratios. The 2019 report shows Langley City as having below average total municipal fees along with the fifth lowest commercial-to-residential property tax ratio and one of the fastest permit approving processes in the Lower Mainland.
Development Cost Charges
Find our development cost charges here to see the charges that would be applied to residential, commercial, and industrial construction, and how those revenues are distributed.
Housing Prices
Median housing prices in the Langley City and Township market combined as of February 2020 (FVREB):
- Single-detached house: $1,029,000
- Townhouse: $589,000
- Apartment: $373,500
2019 Property Tax Rates
Property tax information is available here. It includes a breakdown according to land use and shows how taxes are split up among different service providers. It also includes utility rates and charges for water, sewer, and solid waste, as well as the Downtown Langley Business Association (DLBA) levy.
Information on the provincial Speculation and Vacancy Tax, which may impose additional property taxes on homes that are not permanently occupied or rented, can be found here.
Find information on all the recent business and development activity in the city here. Documents are updated each month with the latest information.
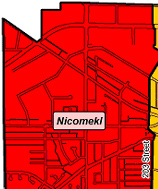
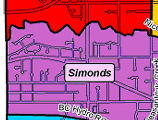
Descriptive and statistical summaries are prepared for each of Langley City's six neighbourhoods following each census period. The latest release incorporates data from the 2016 Census on neighbourhood residents, land use, housing, and development, and also includes overviews of each neighbourhood's amenities and character.
 |
 |
 |
 |
 |
 |